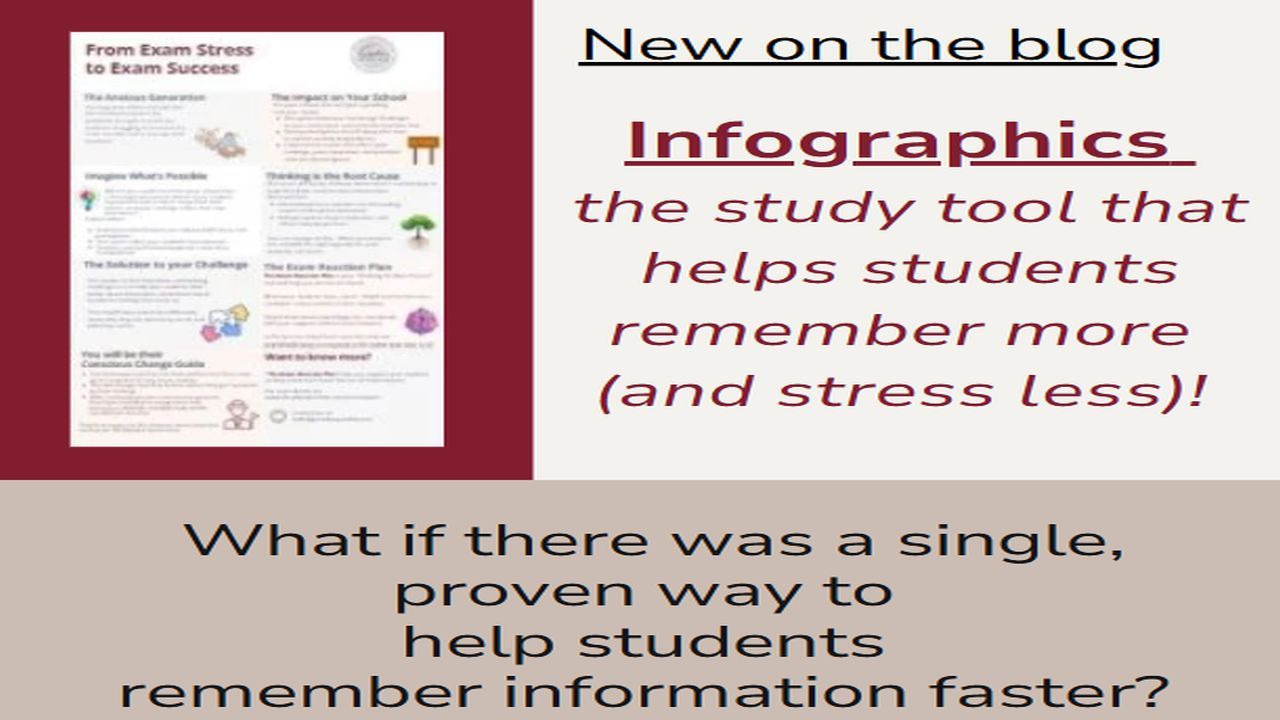
Infographics – the study tool that helps students remember more (and stress less!)

Many students feel overwhelmed, anxious and unable to revise well, often because they haven’t found a good way to absorb information. But what if there was a single, proven way to help students remember information faster? A clear, stress-free way for your students to remember way the info they need – and learn it quickly?
That way is using Infographic in your teaching.
The skill of infographics
Infographics cut down on lengthy explanations that may be quickly forgotten and instead, through both visuals AND text, portray ideas and concept in a clear layout that condenses essential information into small soundbites.
Any course that presents information in an easy-to-follow visual format is likely to win over text.
The purpose of any picture-based course material is to break down hard to follow ideas. The layout is always carefully planned and structured to quickly tell-a-story. It’s the perfect way to share the bare bones of a topic and focus on what matters.
This helps students hone-in on important areas. It’s not so much what’s been left out, as the words that have been used to convey the ‘essential whole’. Think of this as scaffolding that carries the ‘unsaid’. Text that carries the idea, without the fluff.
The aim of a good Infographics is to highlight the barebones of the topic and leave the rest aside.
Visual learning
For our visual learners – those that learn best through pictures and images, this is the very best way of sharing course material. But it’s equally as valuable to ALL types of learners.
It’s a game-changer for retention and revision.
The human brain processes pictures and visuals 60,000 times faster than text and 90% of the information reaching our brain is visual, so why are we so reliant on text to tell the story, when pictures area a clear winner.
Studies show that students using visual aid resources recall up to 65% better than those using just written word materials.
As we see AND read, we built up visual patterns. We come to associate images with info and when we come to recall, these two can be locked together, making it easier to remember.
That’s perfect for those struggling to learn hard concepts, or to understand difficult, long-winded ideas. It’s the brevity and short snips of text that make infographics such a winner for your whole year group of students.
So how can infographics help you in your teaching?
- They help reinforce your lesson
- Offer visual revision worksheets
- Provide condensed information in a clear to follow format
- They simplify topics
- Improve recall
- Engage more learners
- Reduce stress
- Increase learning confidence
The right study tools can make or break success and give your students the help they need to grasp ideas and remember them more easily.
Including Infographics in their exam preparation sessions gives them a visual head-start and improves their chances of easier recall when it matters.
Looking for ways to include visual infographics in classes will help you share key points long after your lesson.
The Exam Stress Bundle is packed with carefully designed infographic and stress management strategies to help students feel confident and ready for their exams.
Want to see how to help students get their panic under control? Click here to grab your school’s Exam Stress Bundle